Get insight into your server with Datadog
I have been running my blog for a few months now on a DigitalOcean droplet. Apart from the few metrics DigitalOcean provides, I never really had any insight into how my server is performing. This includes metrics like CPU and Memory, but also metrics from the applications I run to host my blog, in particular Nginx, php-fpm and MySQL.
To get more insight into these metrics, I decided to install the Datadog agent on my server. Datadog comes with a large selection of integrations for various different applications, including all the applications I am running. The great thing is that Datadog comes with a free plan for up to 5 hosts, although the biggest downside is that the data retention is only for a single day. It is easy to upgrade to a paid plan however, so I might decide to do that sometime in the future.
In this blog post I show how I installed the Datadog agent and setup the integrations to get insight into Nginx, php-fpm and MySQL. Let’s get started!
Installing the Datadog agent #
Before installing the agent, be sure to sign up for an account on the Datadog website. You don’t need a creditcard for the free trial. Next, login on the server on which you want to install the agent.
Installing the Datadog agent is very simple. The Datadog documentation contains installation instructions for many different operating systems, as well as Docker and configuration management tools such as Chef, Puppet and Ansible. For most systems there is a one-line script that can be run to install the agent, but its of course much more fun to do it manually ourselves so we know what’s going on under the hood. For CentOS, the installation is as follows.
First, add the Datadog yum repository to your system by creating the /etc/yum.repos.d/datadog.conf file with the following contents:
[datadog]
name = Datadog, Inc.
baseurl = https://yum.datadoghq.com/rpm/x86_64/
enabled=1
gpgcheck=1
gpgkey=https://yum.datadoghq.com/DATADOG_RPM_KEY.public
Next, install the Datadog agent:
sudo yum install datadog-agent
The datadog configuration can be found in /etc/dd-agent. Copy the /etc/dd-agent/datadog.conf.example to /etc/dd-agent/datadog.conf. We need to add our private Datadog token to this file. Find the line that starts with api_key and copy your token in here. This line should now look as follows:
api_key: [your_token]
Restart the datadog agent with systemctl restart datadog-agent. You can check the status of the agent by running dd-agent info (yes, Datadog is kinda inconsistent in using both “datadog-agent” and “dd-agent”). You should see a green “OK” for the thee integrations that are included by default: network, ntp and disk. Keep in mind that you might need to change your firewall configuration. Datadog only communicates to the outside over HTTPS, so this should be relatively easy. For more information check out their documentation on network traffic.
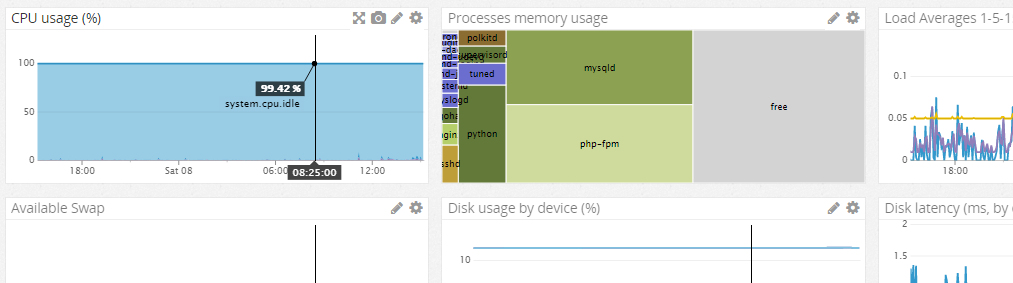
Login to your Datadog account. The starting page is the Events page, which shows any events like hosts that were added, integrations that were added, monitors that were triggered, any custom events created by you, and more. On the left, find the “Dashboards” menu item and click on “Dashboard list”. On the right, under “Host dashboards”, find your host name. You should see the very first data dripping in, which means that your Datadog agent is working correctly!
The “python” entry in the processes memory usage graph includes the memory used by the Datadog agent. Also, there is an inconsistency in the memory usage shown in the “Process memory usage” graph and the “Memory breakdown” graph. You might see that the amount of free memory is shown as higher in the first graph. This is because in this graph, buffers and cache are included in the free memory. In the memory breakdown graph however those are included in the “used” memory. Something to keep in mind.
Now that we have the agent running, it’s time to configure some integrations.
Configuring integrations #
As mentioned, I run Nginx, php-fpm and MySQL to host my blog. Following along with the next sections will give you some experience with setting up your first integrations.
PHP-FPM #
We can configure php-fpm to provide status information on a specified URL through the status-path configuration setting. This is done per php-fpm pool. The status information page provides some statistics such as the number of php-fpm processes running, how many connections are active, how many connections are in the queue, and more. In addition, we setup a ping path using the ping.path and ping.response configuration settings. The ping path can be used to test from the outside to see if php-fpm is still running.
Open your php-fpm pool configuration file (for me, this is /etc/php-fpm.d/www.conf) and make sure the following settings are configured:
pm.status_path = /status
ping.path = /ping
ping.response = pong
Reload php-fpm. With Nginx running in front of php-fpm, we need a server configuration that will forward requests to these URL’s to php-fpm. I use the following configuration for this in /etc/nginx/conf.d/status.conf:
server {
    listen 127.0.0.1:80;
    server_name localhost;

    location ~ ^/(status|ping)$ {
        allow 127.0.0.1;
        deny all;

        access_log off;
        include fastcgi_params;
        fastcgi_param SCRIPT_FILENAME $document_root$fastcgi_script_name;
        fastcgi_pass unix:/var/run/php-fpm/www.sock;
    }
}
As we want to keep this status information to ourselves, we setup the listen directive to only listen to localhost. Nginx will therefore not accept any outside connections to this server configuration. In addition, though perhaps redundant, we use the Nginx http access module to limit access to only localhost by allowing only 127.0.0.1, and denying everything else.
Reload Nginx and test if you setup the configuration correctly by running curl localhost/status and curl localhost/ping (be sure to do so while logged in to your server!). This should give you a list of statistics for the first request, and the word “pong” on the second request.
Finally we can enable the Datadog integration. In the /etc/dd-agent/conf.d directory you will find a list of example configurations for many different integrations (87 on my machine). We can ’enable’ such an integration by renaming or copying an example file, for example copy/rename php-fpm.yaml.example to php-fpm.yaml. By default, the file looks as follows which is already correct for our php-fpm configuration:
init_config:

instances:
  - # Get metrics from your FPM pool with this URL
  status_url: http://localhost/status
  # Get a reliable service check of your FPM pool with that one
  ping_url: http://localhost/ping
  # Set the expected reply to the ping.
  ping_reply: pong
Restart the Datadog agent again with systemctl restart datadog-agent. Run dd-agent info to see php_fpm added to the list of Checks. If it shows a green OK, this means the agent can correctly send the metrics to Datadog.
Though optional, in the Datadog dashboard we can also “enable” an integration. While logged in, find the “Integrations” menu item on the left and click on “Integrations”. On this page, find php-fpm and click on the item to open a popup. On the “Configuration” tab, scroll to the bottom and click on “Install Integration”. This created a new dashboard for you which you can find on the dashboard list page under the “Integration Dashboard” settings. Click on the “PHP-FPM - Overview” dashboard and you will find your php-fpm metrics!
Nginx #
Similar to php-fpm, we can also enable a status page in Nginx using the HTTP status stub module. We can easily re-use the Nginx configuration we setup earlier for the php-fpm status page. Open the /etc/nginx/conf.d/status.conf file and append the bold part in the following stub.
server {
  listen 127.0.0.1:80;
  server_name localhost;

  location ~ ^/(status|ping)$ {
    allow 127.0.0.1;
    deny all;

    access_log off;

    include fastcgi_params;
    fastcgi_param SCRIPT_FILENAME $document_root$fastcgi_script_name;
    fastcgi_pass unix:/var/run/php-fpm/www.sock;
  }

  location /nginx_status {
    stub_status on;
  }
}
Restart Nginx and test if the status page is accessible from your server by executing curl localhost/nginx_status. This should provide you with some statistics such as active connections, total number of handled requests, and more.
We can now setup the Datadog Nginx integration to use this URL for fetching metrics. Copy or rename the /etc/dd-agent/conf.d/nginx.yaml.example to nginx.yaml and use the following configuration:
init_config:

instances:
 - nginx_status_url: http://localhost/nginx_status/
Reload the agent and enable your integration in the Datadog dashboard as you did earlier with php-fpm. An Nginx dashboard will now be available with the new metrics.
MySQL #
Datadog requires a MySQL user to fetch metrics about MySQL. It’s a best practice to use a unique user with only those permissions it really needs. We don’t need Datadog to look into the actual data of our tables, so we only grant permissions to query info about the process metrics. Log into the MySQL console on your server and create a user with the appropriate permissions with the following queries:
CREATE USER 'datadog'@'localhost' IDENTIFIED BY '[**password**]';" GRANT PROCESS ON *.* TO 'datadog'@'localhost';
Be sure to generate a secure password; keep this password somewhere for now as we need it in a minute to setup our Datadog integration with this password. If your MySQL server is replicating with another server, you can also grant the REPLICATION CLIENT permission to query for metrics related to replication.
Again, copy or rename the mysql.yaml.example configuration file to mysql.yaml in the /etc/dd-agent/conf.d directory and configure it with the following settings:
init_config:

instances:
  - server: localhost
    user: datadog
    pass: [password]
    options:
       replication: false
       galera_cluster: false
       extra_status_metrics: false
       extra_innodb_metrics: false
       extra_performance_metrics: false
       schema_size_metrics: false
       disable_innodb_metrics: false
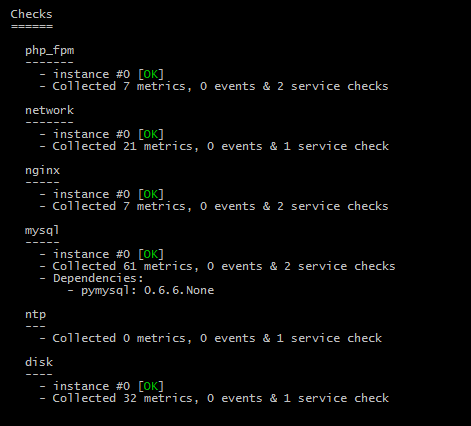
Be sure to replace the password with the one you used for the MySQL user before. For now, I’m not enabling any extra configuration settings. Be sure to check out the Mysql integration documentation to see if you want to get any additional metrics. As always after installing an integration, restart the agent with systemctl restart datadog-agent and use dd-agent info to verify that Datadog is sending the new metrics successfully. With all three integrations now enabled, your screen should look something like this:
Conclusion #
I hope this post has shown how easy it is to get quite a bit of insight into the performance of your server and the applications running on it. Unfortunately, the free Datadog plan has a retention period of only one day. This is what I consider the biggest downside as it will cost $15 a month to get a longer retention period for my single host. However, the ease with which the agent and integrations are installed make it a breeze to use. Definitely give it a chance and decide for yourself whether the money is worth it or that the single day of retention might be enough for you.