Measure your golden signals with GKE Managed Prometheus and the nginx-ingress

Getting started with setting up proper monitoring dashboards for your application and infrastructure can be challenging. Where to begin? My typical answer to such a question would be to start with the “Golden Signals”. This blog post will dive into the golden signals and share how you can get started with these signals in Google Cloud using Managed Prometheus and the nginx-ingress controller.
The Golden Signals #
The four golden signals - coined by the Google SRE book - can be considered a guide as to what at least to monitor for your applications. The golden signals are:
- Latency. The time it takes to serve a request - how long does it take for clients to get a response?
- Traffic. The number of (HTTP) requests made on a service.
- Errors. The number of requests that fail, typically HTTP 5xx errors.
- Saturation. The extend to which your system is utilized.
I recommend reading the previous link to learn more about the golden signals and monitoring in general. What’s primarily important is that these signals (counter-intuitively) provide insights into symptoms of issues instead of causes. There can be many reasons why your application is misbehaving. Having insights and/or being alerted on all these possibilities is impossible. Therefore, the golden signals focus on factors that would be noticeable to your end-users when your application is having issues. These are the metrics that can tell you if something is going on. Then you’ll dive deeper into other metrics to learn what is going on.
In this post, I’ll ignore the Saturation signal. As we’ll see, the nginx-ingress metrics will give us insights into the other three signals. Saturation signals such as CPU, Memory and autoscaling metrics can be exposed through other means such as with kube-state-metrics. Right now I’ll focus on the metrics that the nginx-ingress controller exposes.
Managed Prometheus and Google Cloud Monitoring #
Earlier this year, Google made Managed Prometheus generally available. Prometheus is still one of the most popular monitoring services out there. It’s an interesting prospect not having to deploy and maintain Prometheus ourselves anymore but to leave that in the capable hands of Google.
Especially interesting is that metrics scraped by Managed Prometheus are made available automatically within Google Cloud Monitoring. This built-in service in Google Cloud allows you to gain visibility into your applications and infrastructure. You can now seamlessly include whatever metrics you scrape with Prometheus in any Google Cloud Monitoring dashboard, giving you easy insights into GCP infrastructure and your applications.
The nginx-ingress controller #
The nginx-ingress controller is one of the most popular Ingress controllers for Kubernetes. The controller exposes a set of metrics that we’ll use to get insights into the golden signals.
Installation #
Let’s ensure we have everything we need to get some visibility into the nginx-ingress metrics in Google Cloud Monitoring.
Prerequisites:
- A GKE Kubernetes cluster running at minimal version
1.21.4-gke.300with the Managed Prometheus service enabled. Either create a new cluster or edit an existing cluster withgcloud beta container clusters update <cluster name> --enable-managed-prometheusor in the console - At least one HTTP application that is or can be made available through an Ingress
Installing and configuring the nginx-ingress #
Now let’s install the nginx-ingress controller. The easiest way to do this is with Helm:
helm upgrade --install ingress-nginx ingress-nginx \
  --repo https://kubernetes.github.io/ingress-nginx \
  --namespace ingress-nginx --create-namespace \
  --set controller.metrics.enabled=true
Important: do not enable the serviceMonitor (controller.metrics.serviceMonitor.enabled). The serviceMonitor CRD is part of the prometheus-operator and will configure it to start scraping the nginx-ingress metrics. However, we will create a podMonitor resource for the Managed Prometheus service instead.
We need an Ingress resource that exposes an application in your Kubernetes cluster through a GCP load balancer. As it depends on your application how to configure this, follow the nginx-ingress documentation to create this. Ensure your application is reachable through this Ingress.
Finally, let’s create the podMonitor. This will configure Prometheus to start scraping the nginx-ingress metrics. By default, the nginx-ingress controller exposes these metrics through port 10254. So that’s what we’ll configure in the podMonitor. Deploy the following to your cluster:
apiVersion: monitoring.googleapis.com/v1
kind: PodMonitoring
metadata:
  name: ingress-nginx-metrics-monitoring
  namespace: ingress-nginx
spec:
  endpoints:
  - interval: 5s
    port: 10254
  selector:
    matchLabels:
      app.kubernetes.io/name: ingress-nginx
Notice that this resource is installed in the same namespace as the nginx-ingress controller. The PodMonitoring resource can only scrape pods in the same namespace. If you want to scrape pods across multiple namespaces, use the ClusterPodMonitoring resource instead.
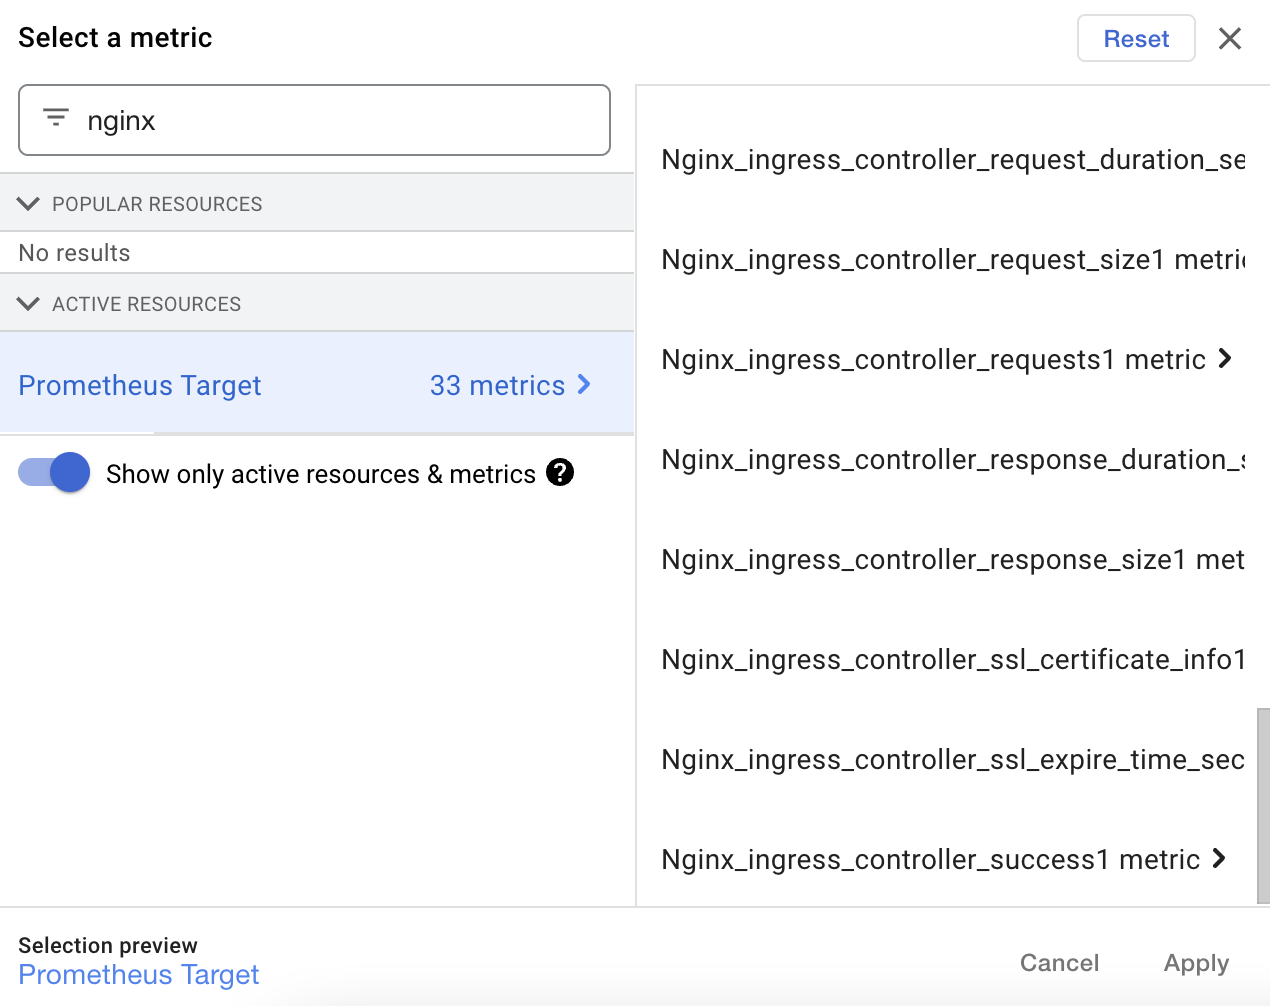
And that’s it! Within a few minutes, the metrics should appear in Google Cloud Monitoring. In the screenshot below, you can see a subset of the 33 metrics now available.
Gaining insights #
As mentioned, the nginx-ingress metrics give us insights into three of the golden signals. More concretely, they map as follows:
- Traffic:
nginx_ingress_controller_requests - Latency:
nginx_ingress_controller_request_duration_seconds - Errors:
nginx_ingress_controller_requests, filtered onstatus=5xx
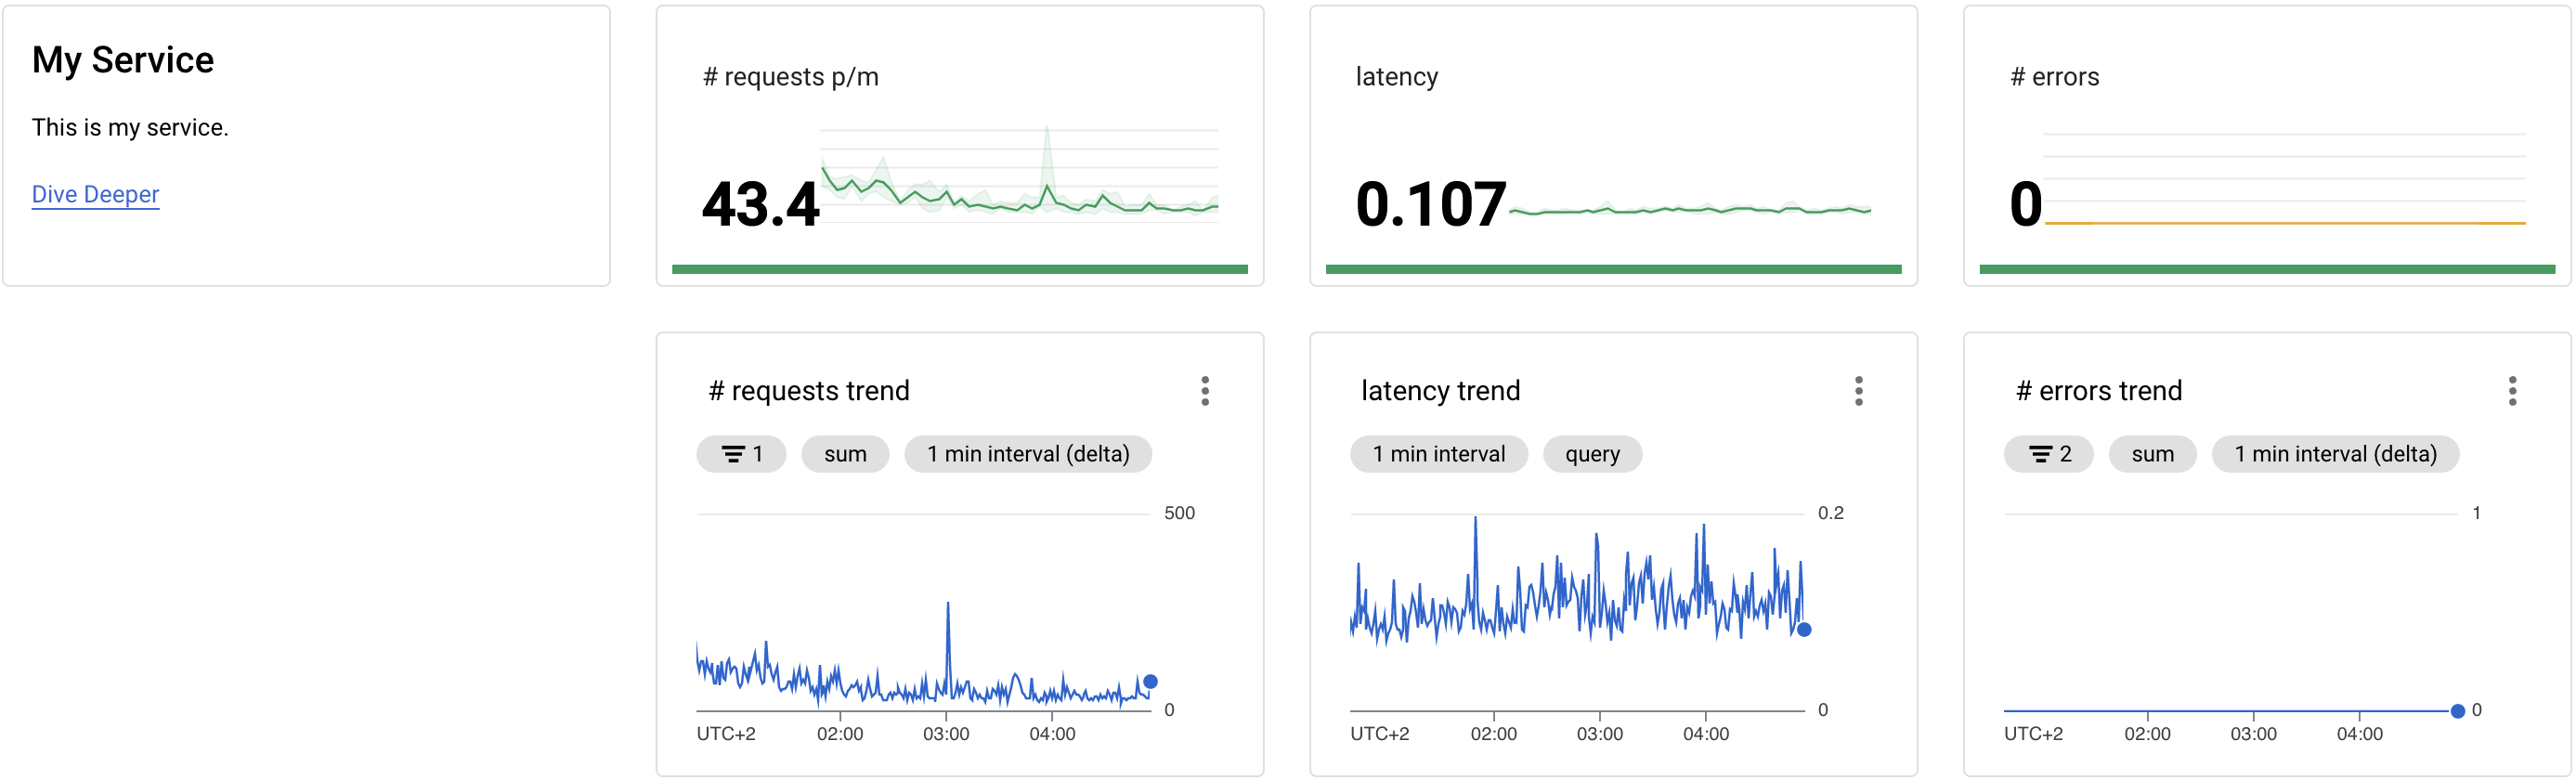
Below you can see how these metrics can be displayed in a Google Cloud Monitoring dashboard. I always prefer to have at least 2 “layers” of dashboards. The screenshot below shows what I call an “Application Landscape” dashboard. This dashboard displays the most important (at least the golden signals) metrics for all services. Would I have more services, I would add relevant metrics for that service to this dashboard.
The second layer is the Application dashboard. This is what the “Dive Deeper” link points to in the below Application Landscape. When the metrics show that something is off, you can click on this link to go to a dashboard that shows more metrics that hopefully explain what is going on. You can also add more links; other links might point you to the application logs or an APM dashboard. Going back to the theory of distinguishing symptoms and causes: the Application Landscape primarily shows symptoms (is something going on?), the Application dashboard shows potential causes (what is going on?).
To create this dashboard in your GCP environment, you can import my JSON export of this dashboard. Be sure to change some of the filters to properly select your Ingress resource. Look for lines such as the following to change:
"filter": "metric.type=\"prometheus.googleapis.com/nginx_ingress_controller_requests/counter\" resource.type=\"prometheus_target\" metric.label.\"ingress\"=\"my-service\"",
The metric type here is the one that maps to the “Traffic” golden signal. Change my-service to the name of the Ingress that you want to monitor.
Next steps #
You now have a dashboard that displays the golden metrics for your application. However, this is only the beginning. Start building a second dashboard for your application with the potential causes. Expand your dashboards as you learn more about your applications and infrastructure. You learn the most after a production incident: were you able to quickly identify the cause through your dashboards? What other metrics should have been there to identify the cause more quickly? Were you alerted of the issues in time?
I can also recommend organizing game days or performing other chaos engineering practices to test the value of your dashboards. These are great ways to test if your dashboards display usable information.
Finally, Google Cloud Monitoring is a simple and relatively cheap way togain more insights into your applications and infrastructure - when you’re using GCP of course. However, Cloud Monitoring is certainly less powerful compared to other solutions such as Grafana, Datadog or NewRelic. The downside is that the other tools require more effort (when self-hosting Grafana) or are more expensive. If Google Cloud Monitoring is too limiting for you, know that more powerful tools exist that you might want to give a try.